When traders and analysts are watching the market, they are constantly studying trends and patterns in the hopes of detecting the next most likely price movement.
Finding and correctly identifying patterns, as well as comprehending their significance, is critical to successful trading.
The head and shoulders pattern is significant because it has a long history of being reliable among market analysts. We'll go over this pattern in depth below, explaining its significance and how you can profit from it.
The Fundamentals of the Head and Shoulders Pattern
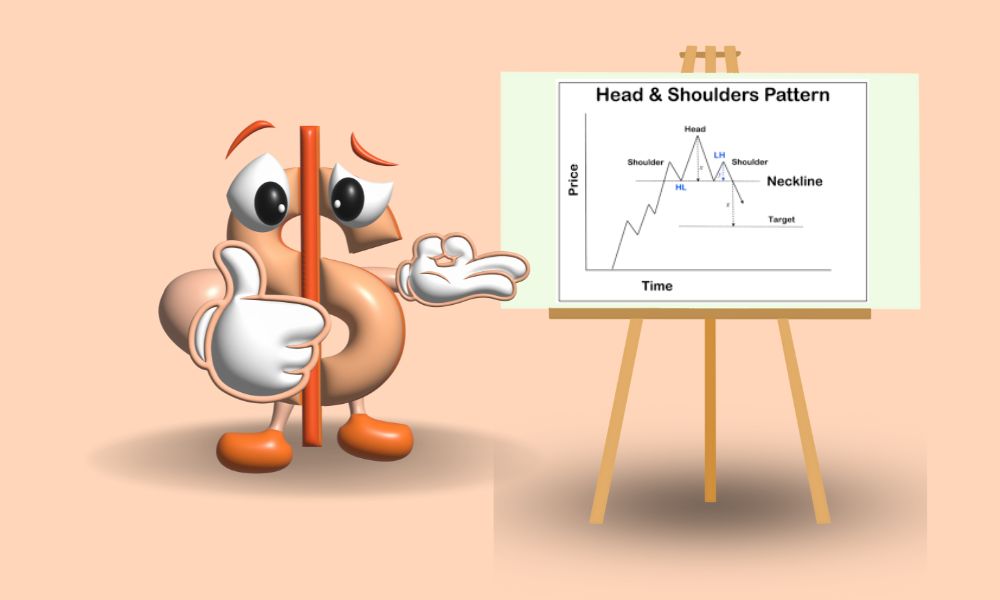
In technical analysis, the head and shoulders pattern is a chart formation that usually indicates a trend reversal in which the market shifts from bullish to bearish, or vice versa.
This pattern has long been regarded as a reliable predictor of trend reversal.
Before we go any further, it's important to remember that the head and shoulders pattern is almost never perfect, which means that there will almost always be small price fluctuations between the shoulders and the head, and the pattern formation is rarely perfectly shaped in its appearance.
Head and shoulders patterns can also form in the opposite direction, indicating a market reversal and a shift from bearish to bullish trend.
This is known as an inverse head and shoulders pattern, and it is simply the inverse of the pattern we just described - or, in other words, an upside-down head and shoulders pattern.
As a result, the inverse pattern indicates that the market is transitioning from a downward trend to an upward trend.
Stock prices will dip into three lows, separated by two temporary price rallies, with the inverse head and shoulders pattern.
The middle trough, which would be the inverse pattern's head, is the deepest, while the shoulders are slightly shallower.
Prices will make a final rally once the second shoulder has formed, breaking above the neckline and indicating that the bearish trend has reversed and bulls are likely to take control of the market.
The head and shoulders pattern is popular among traders due to its unique ability to assist them in determining price target estimates once the pattern has completed itself and the neckline has been crossed. It also makes placing stop-loss orders simple for traders.
Stops are typically placed above the top-of-the-head high price in the case of a peaking head and shoulders pattern.
Stops are typically placed below the low price formed by the head pattern in an inverse head and shoulders pattern.
Return to the pattern and measure the distance vertically from the top of the head to the neckline to estimate how much prices will move after the neckline is broken.
Then, after the pattern has formed its second shoulder, subtract that same distance from the neckline in the opposite direction, beginning at the point where prices first crossed the neckline.
For example, if the distance between the neckline and the top of the head represents $20 in a stock's price, analysts would expect the stock to fall at least another $20 below the neckline price level once the neckline is broken.
Although this is only an estimate, many traders believe the figure and believe that prices will fall by at least that much.
When dealing with a traditional head and shoulders pattern, you would measure the vertical distance from the top of the head down to the neckline, allowing you to calculate the estimated spread amount as previously discussed.
Of course, the opposite is true when dealing with an inverse pattern. Calculate the vertical distance from the top of the head to the neckline to get an idea of how far prices are likely to rise beyond the neckline.
Trading with the Pattern
It is critical to wait for a head and shoulders pattern to complete before making any trades.
If a pattern appears to be forming or is in the process of forming, you should not assume that it will fully develop and make trades based on your expectations.
The market can be volatile and change at the drop of a hat, so keep an eye on trends as they emerge and be patient. Try not to overestimate your abilities.
Plan your trades ahead of time so that you're ready to go when the neckline is broken.
Keep an eye out for variables that may necessitate changing your entry, stop, and profit targets.
There is an alternate entry point that traders frequently choose; however, it necessitates due diligence, patience, and quick action at the right time.
Traders who take this alternative approach observe the pattern and wait for prices to retrace upward to, or slightly above, the neckline level after the neckline is broken.
This is a more conservative trade that frequently allows a trader to enter at a lower price.
However, there's a chance you'll be waiting for a retracement that never materialised and thus miss out on the trading opportunity entirely.
Finally, it's critical to stick with trades that respect your risk tolerance and help you achieve your trading objectives.
The head and shoulders pattern has historically been shown to be fairly reliable in a space that is notoriously unpredictable.
It is also one of the most easily identified chart patterns. No chart pattern is 100% accurate, but when the head and shoulders pattern correctly predicts a major trend change, it represents a correspondingly large profit opportunity.
Those who are staying with me till the end of this article, my hearty thanks to them.
Copyright© 2025 by Currenciesfactory.com

